
Spectro
A real-time audio spectrogram visualizer powered by WebGL. Use your microphone or upload a file and watch frequencies paint across the screen in vivid color.
About Spectro
Point a microphone at your speakers, hum a note, or drop in an audio file — Spectro instantly maps every frequency into a rolling cascade of color. Low rumbles pool at the bottom in cool blues while sharp highs streak across the top in warm reds and yellows, all rendered in real time via WebGL. It's part diagnostic tool, part accidental art.
Audio engineers use it to spot problem frequencies, musicians use it to study overtones, and curious people use it to see what everyday sounds actually look like. Singing a vowel and watching the harmonic series stack up is genuinely surprising. It's a useful corner of the broader music space that rarely gets this much visual clarity in a browser.
If you want to go further and actually shape those frequencies yourself, DSP Playground pairs well as a next step. Spectro works best with headphones unplugged — feed it speaker output and the feedback creates patterns worth staring at for a while.
Look inside
How to use
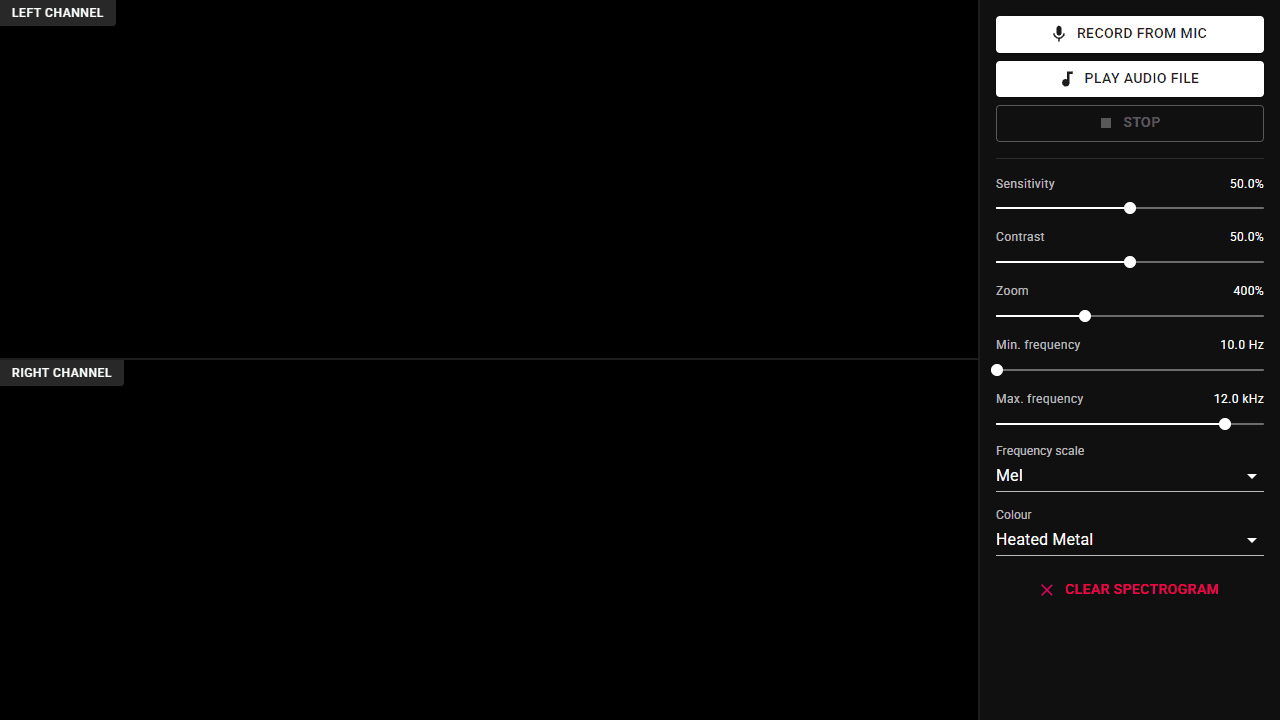
• Click "🎤 Record from mic" to visualize sound from your microphone in real-time, or "🎵 Play audio file" to upload and analyze an audio file from your device • The spectrogram displays frequencies over time - time flows right to left (newest audio on right), frequency from low (bottom) to high (top), with brightness showing loudness • Use "⏹ Stop" button to end recording or playback • Adjust settings in the right panel: - Sensitivity: controls volume/audio detection level - Contrast: applies scaling to make patterns more visible - Zoom: magnifies the time axis view - Min/Max frequency: sets which frequency range to display - Frequency scale: choose Linear (even spacing) or Mel (natural weighting toward lower frequencies) - Color: change the color scheme • The display shows separate spectrograms for left and right audio channels • Grant microphone permission when prompted to use microphone recording
Reviews
No written reviews yet. Be the first!
More from Music

A browser theremin. Move your mouse to control pitch and volume, generating eerie continuous tones via the Web Audio API.
by mdn


