
Graphing Calculator
Plot mathematical functions in real-time on an interactive graph. Supports trigonometric, logarithmic, and polynomial functions.
About Graphing Calculator
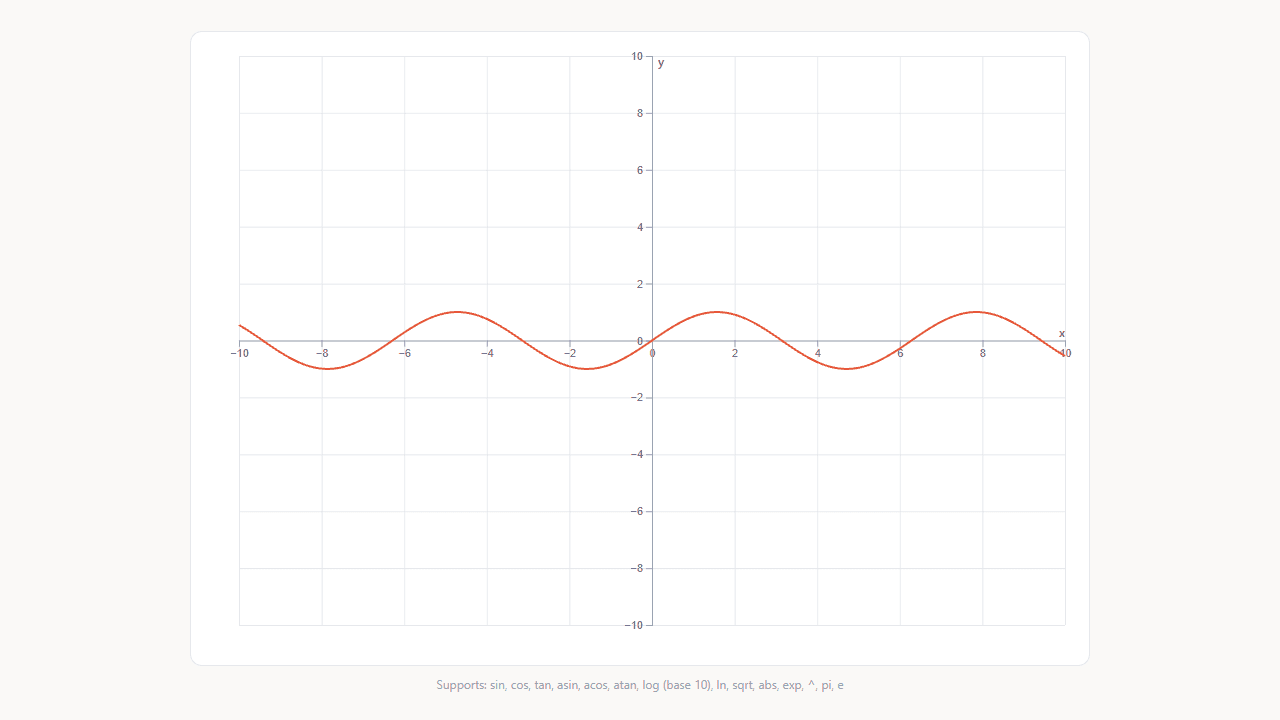
Type a function — sin(x), log(x), a polynomial, whatever you need — and watch the curve appear on an interactive graph before you finish the equation. Pan and zoom with your mouse or trackpad to inspect any part of the plot up close. It's immediate, visual feedback that makes abstract equations feel concrete.
This is a practical tool for students working through trigonometry or calculus, but it's just as useful for anyone who wants to see how changing a coefficient reshapes a curve. Browse more tools like it in education, where you'll find everything from periodic tables to flashcard decks.
Works entirely in the browser with no account or install required — just open it and start plotting. A keyboard is strongly recommended; touch input works for panning, but entering functions is much faster with physical keys.
Look inside
How to use
This is a mathematical tool for visualizing functions on a coordinate plane. • Type mathematical functions in the input field using JavaScript syntax (e.g., Math.sin(x), x*x, Math.tan(x)) • Use "x" as your variable - the calculator will plot y-values for x ranging from -10 to 10 • Click "Plot" button or press Enter to graph your function • The graph displays on a coordinate grid with x and y axes ranging from -10 to 10 Common function examples: • Linear: 2*x + 3 • Quadratic: x*x - 4 • Trigonometric: Math.sin(x), Math.cos(x), Math.tan(x) • Exponential: Math.exp(x) • Logarithmic: Math.log(x) The calculator automatically handles discontinuities and invalid values. If your function contains errors, check your syntax - use Math.sin() instead of sin(), multiply with *, and use parentheses for grouping. Each new function replaces the previous graph.
Reviews
No written reviews yet. Be the first!
More from Education

A geography speed-quiz. Type country names against the clock — every one you nail lights up the map. Eight maps (world + every continent), three paces, leaderboards, percentile standings, and a per-answer rarity stat that shows how many other players named each country.
by geodude


